AI-NATIVE SERIES · HARNESS ENGINEERING
Silence Is Not a Status
One minute
Over three days I found four automations that were quiet. Quiet is what a healthy system looks like — and also what a dead one looks like. A dashboard was empty because the only command that could fill it had never been run. A weekly job read green because a hand-click had covered for a schedule that failed. Three merged pull requests were not live because a deploy quota had silently stopped building. And the checker I wrote to catch that last one printed “skipping” and exited success. The fix is not vigilance. A smoke detector with a dead battery makes exactly the same sound as one that works, so you make the working state noisy — a beep that means “still alive” — and then silence can only mean broken. Monitoring teams have shipped that for a decade under the name dead man’s switch; almost nobody applies it to their own agent harness.
The week in one number
Four. Over three days, across a codebase I own and audit obsessively, I found four independent automations that had stopped doing their job and told no one. Not one of them threw an error. Not one of them turned a dashboard red. Each of them, by every signal I had built to watch them, looked exactly like a system working perfectly.
I want to be precise about the embarrassment here, because the lesson lives in it. I am not describing a legacy system I inherited. I built all four. Two of them I had shipped that same week, and one of them was the tool I had written specifically to catch this class of bug.
The mental model: the battery you never hear die
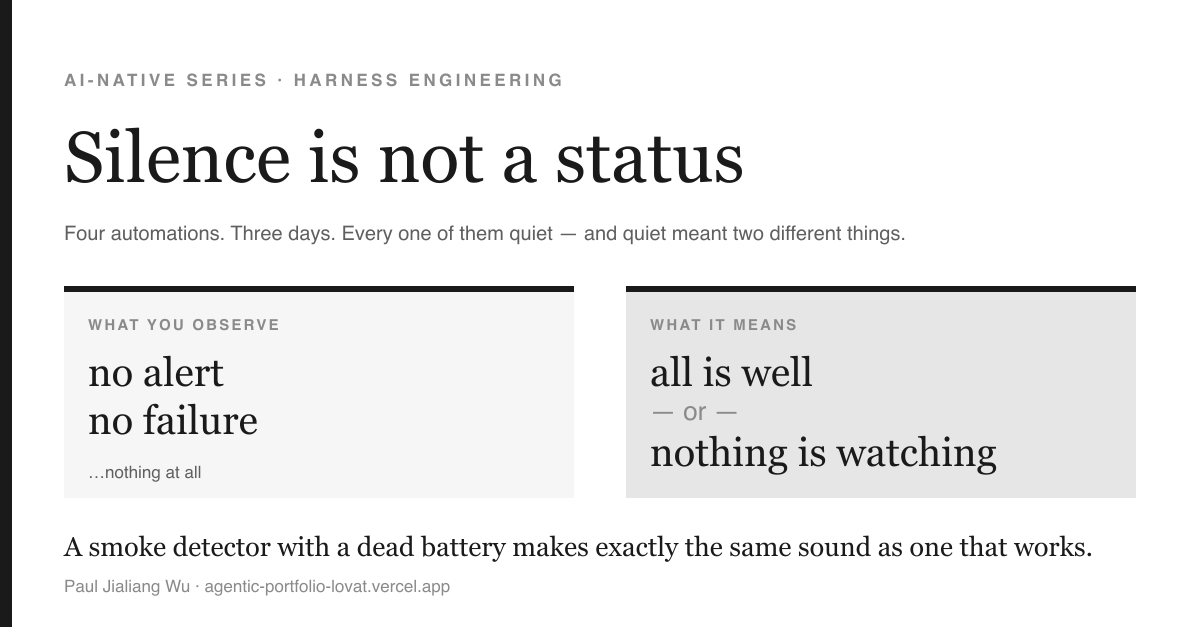
A smoke detector with a dead battery makes exactly the same sound as a smoke detector that is working: none. The absence of a beep is not evidence that your house is safe. It is evidence of nothing at all — the observation is identical in both worlds.
That is the entire idea, and if you take one thing from this article, take this: silence is not a status. It is the absence of a status, and your brain will helpfully fill the gap with the reading you prefer. Every automation you own has two states that look the same from the outside — running and finding nothing, and not running — and unless you have done specific work to separate them, you cannot tell which one you are in.
The reason this is hard is not technical. It is that “nothing happened” feels like information. It is not.
What I actually found
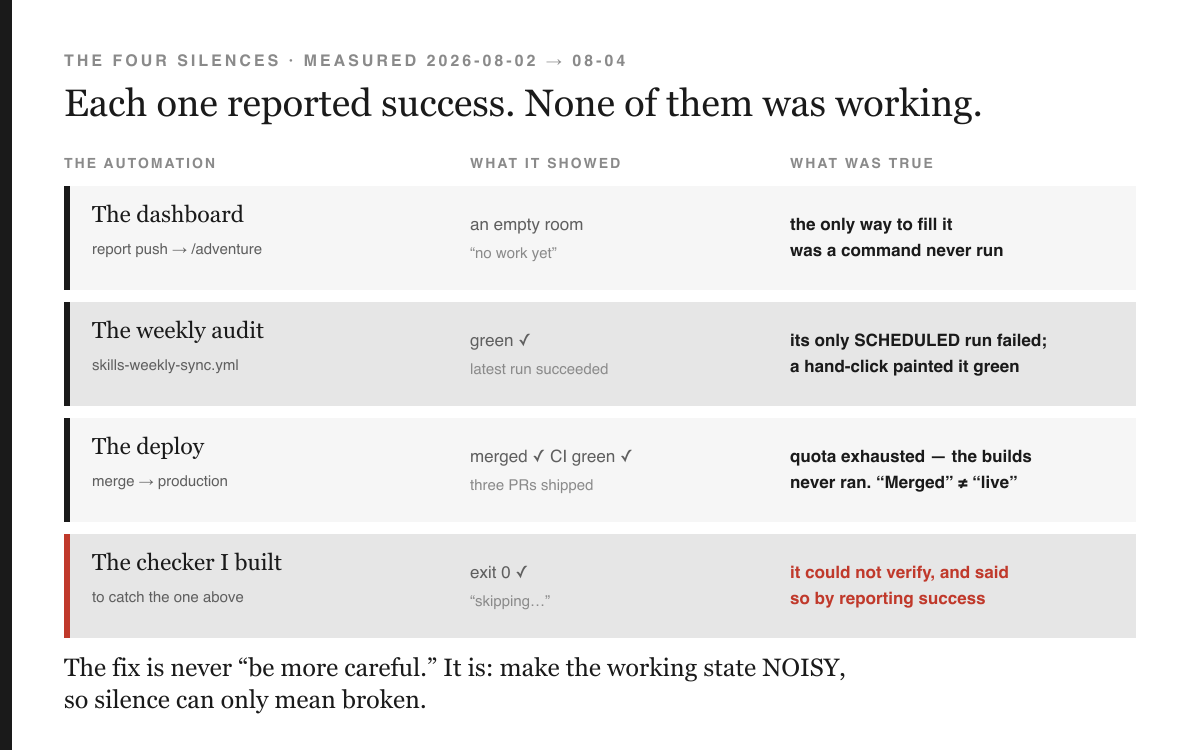
One: a dashboard that was structurally unfillable. I had built a private
report-card dashboard and wired it to accept data pushed by a CLI command. That command needs a
secret token. The token is stored as a Vercel Sensitive environment variable, which means
it cannot be read back — vercel env pull returns an empty string for it. So the push
could only ever be run by hand, by the one human who knew the passphrase, and in the weeks the
feature existed it had been run zero times. The room was gated and empty. Empty is
indistinguishable from broken, and for three separate reports I told my collaborator it was a
one-line task for him rather than treating a blocker I owned as the bug.
Two: a weekly job that had never fired. I checked the run history of every cron-scheduled workflow in the repository. The nightly one was genuinely healthy: five of five scheduled runs succeeded. The two weekly ones were not. One had a single scheduled run in its history and that run had failed; a manual re-run afterwards had succeeded, so every summary view — the workflow list, the little green check, the badge — reported the workflow as passing. The other had three runs in its entire life, all of them triggered by a human pressing a button.
This is the subtlest of the four, so sit with it: a manual run is exactly what the cadence exists to replace, and it is also what makes a broken cadence look fine. The automation was not automating. The human doing the job by hand was the reason nobody noticed the automation had stopped.
Three: merged did not mean live. Three pull requests merged, CI green on all three, and the deployed site kept serving an older build for hours. The hosting free tier caps production deployments at 100 per day (Vercel, n.d.). Past that, merges succeed, checks pass, and nothing deploys. There is no red anywhere. The word “merged” had quietly stopped meaning “live”, and every habit I had was built on those two words being synonyms.
Four: the checker that reported success when it could not tell. Having found
number three, I wrote a guard: publish the commit SHA that is actually serving traffic, compare it
to origin/main, fail if they differ. Good. Then I ran it, and it printed · the
deployment reports no commit SHA — skipping and exited zero.
I had built a detector for silent failure whose own failure mode was to fail silently. It could not determine the answer, so it reported the good one. In a green pipeline, “I could not check” and “I checked and it is fine” render as the identical tick.
Why nobody noticed: the manual run that paints it green
Three of the four share a mechanism, and it is worth naming because it will be in your systems too. In each case a human action produced the same observable signal as the automated action — and the observable signal is all anyone ever looks at.
A person clicked “run workflow” and the badge went green. A person could have run the push command and the dashboard would have filled. A person read “merged” and inferred “deployed.” The manual path and the automatic path converge on one indicator, and the indicator cannot tell you which path produced it. The automation decays, the human quietly compensates, and the dashboard never changes colour.
The industry solved this, and I had not read my own field
None of this is novel. Monitoring teams hit it in the 2010s and produced a specific, boring, excellent answer.
Google’s Site Reliability Engineering chapter on monitoring, written by Rob Ewaschuk, insists on an unglamorous property: “Rules that generate alerts for humans should be simple to understand and represent a clear failure” (Ewaschuk, 2016). His stated reason is signal-to-noise and robustness — the paging path must be simple because it is the part you cannot afford to have wrong. I would add my own: it is also the one path you cannot debug with your alerting. To be straight about what that chapter does and does not give you, though: it contains nothing about the ambiguity of silence. I checked. The answer below is not Google’s.
And the pattern that directly answers ambiguity-of-silence is the watchdog, described by PromLabs as “a watchdog alert (also sometimes called a ‘dead man’s switch’, sentinel alert, beacon alert, or heartbeat alert) that helps you continuously test your entire alerting pipeline from beginning to end” (PromLabs, n.d.). The mechanism is a beautiful inversion: you create one alert that fires constantly, forever, when everything is healthy, and you route it to a service outside your stack. As PromLabs puts it, “When anything in your alerting pipeline breaks, the external service will then notice that no more alert notifications are coming in and will send you a notification about it.”
Read that again with the smoke detector in mind. Every other alert fires when something breaks. This one fires when nothing is broken — so silence becomes the failure signal. You have converted the ambiguous observation into an unambiguous one, by making the healthy state the loud state.
I had been building agent harnesses for months and had never once applied to my own automations a pattern I would have called obvious in a production cluster. The reason, I think, is that a personal harness does not feel like infrastructure. It is a few YAML files and a CLI. But a cron job you rely on is infrastructure, and it decays exactly like the paid kind.
The second discovery: I weighed the wrong rope
The same week, my collaborator raised a different upgrade: with frontier models this capable, a long system prompt has stopped being access and become a liability — trim it.
He was right, and I had already proved it, which is the interesting part. Months earlier I had run a three-arm ablation — full prompt, a three-line minimal prompt, and no prompt at all — across three models, on six capability cases scored deterministically as the fraction of assertions met (plus four injection cases scored pass/fail). All three arms, in full:
| prompt arm | Sonnet-5 | Opus-5 | Haiku-4.5 (weak control) |
|---|---|---|---|
| full (161 words) | 100.0% | 100.0% | 88.9% |
| minimal (3 lines) | 100.0% | 100.0% | 96.7% |
| none (empty) | 100.0% | 100.0% | 96.7% |
The frontier models are flat at 100% whether they are given the prompt or nothing at all. The weak control scores worse with the prompt than without it, and minimal and empty are indistinguishable. The recorded verdict was blunt: the prompt is not paying for capability, and it is not paying for safety either — what holds the line is the harness, because the tool layer refuses illegal moves and there is no dangerous tool to call in the first place.
So: agree, trim, done? No. Because the thing I had ablated was an 881-byte prompt attached to one feature. The prompt that actually loads on every single session is the skill file — the router that tells the agent what the tool can do. I had never measured it.
It was 23,016 bytes, about 5,750 tokens. Twenty-six times the size of the prompt I had carefully ablated. And it had grown from 16,704 bytes to 23,016 in eleven days — a 38% increase without a single reduction, roughly 1,700 bytes of which I had added that very day.
Current practice makes the comparison sharper than I expected. In an analysis of the Agent Skills convention, Aurimas Griciūnas reports that “the median discovery cost is ~80 tokens per skill” while “body size ranges from ~275 tokens (internal-comms) to ~8,000 tokens (skill-creator), with a median around 2,000” (Griciūnas, 2026). Mine was 2.9× the median. The same piece names the cost: “As context grows, the model’s attention degrades and important information gets buried. Models reliably miss information placed in the middle of long contexts, a well-documented phenomenon called ‘lost-in-the-middle.’”
One honest caveat about my own framing, because that source undercuts it if you read it carefully. Griciūnas describes a three-tier architecture in which discovery costs ~80 tokens and the body loads only on activation — so for most skills, a fat body is not an every-session cost at all. It is one for this skill specifically: it is invoked by name, as a slash command, at the start of the work. Activation is every session here. That makes the number real for my case and not generalisable to yours, which is a distinction I skated over the first time I wrote this paragraph.
Here is the part that made me laugh out loud. Section 4 of that skill file is titled Situational playbooks (progressive disclosure). It explains, at length, that you must not carry context you do not need — and then inlines all nine playbook bodies, 8,410 bytes, 36% of every session, whether or not the task matches. The document preaching progressive disclosure was the single largest violation of it in the repository.
What I did about it — and why a trim was the wrong fix
The obvious response is to delete some words. I did not do that, because a trim regrows. I had just watched this file gain 38% in eleven days, one reasonable-looking row at a time, each one justified. Nothing in the system made the cost of a new row visible at the moment someone added it.
So instead of trimming, I put the file on a scale. A test now pins its size, refuses a budget more than 10% above the actual size (a slack budget is decoration, not a limit), and fails the build if the file grows. Raising the number is allowed — but it has to happen in a diff, with a reason, where a reviewer sees it. You cannot solve accretion with an act of will; you solve it by making the trade explicit at the moment of the trade.
It caught me within the hour. I added one row documenting the new satellite-sync command, went 363 bytes over, and the build went red. Per my own rule I had to pay for it, so I compressed two verbose “this feature does not exist” tombstones and cut a historical aside. The file shrank for the first time in its life. Then I did the real work — moved all nine playbook bodies into separate files loaded on trigger match, leaving an index of trigger, one-line gist, and path.
22,833 → 17,681 bytes. A 22.6% cut, about 1,300 tokens back on every session, with nothing deleted: a companion test fails if the index points at a missing file, or if the extracted bodies shrink below a floor. A token win achieved by throwing away hard-won lessons is not a win, and the test is what stops me from taking that shortcut when I am tired.
The other half: the pointers that had quietly rotted
The same audit turned outward. Each of my meta-repositories integrates highly-rated external projects as satellites: a pointer plus a SHA-pinned digest, never a fork. The house rule, written down long ago, is that “freshness is measured, not promised.”
It was a promise. Of 131 external satellites, 76 (58%) had no pinned SHA at all, so drift was undetectable by construction. One repository held 59 of them, pinned zero. I then checked the first 40 satellites that had a pin to check — drift is only measurable against one — and found 18 that had moved past it, including the seed repository the whole collection was built around, plus 15 that no longer met the admission criteria: one idle for 111 days, one for 180, one for 468 days and sitting at 225 stars against a 500-star bar that nobody had recorded an exemption for.
My first count of the fleet was also wrong, and I want to leave that in. I reported “178
satellites, 124 unpinned” before noticing that three different kinds of thing share the filename
registry.yml: real external satellites, a repository’s own internal skill inventory, and
a list of my own components. Two of the repositories were pointing at themselves. The corrected
number is 131 external satellites, of which 55 were pinned and 76 were not.
Those two counts do not subtract cleanly, and the discrepancy is instructive. Going from 178/124
to 131/76 removes 47 entries but only 48 unpinned ones — so the pinned total rose by one,
during what I described as a purely subtractive correction. It rose because the second pass fixed
two things, not one: the population and the definition. My first script counted an entry as
pinned only if it carried a key literally named head_sha. One satellite records its pin
as pinned_sha, so it had been sitting there pinned the whole time and I had counted it
as a gap. A measurement you have not tried to falsify is just a number you like —
including, it turns out, the corrected one.
Patterns and anti-patterns
Anti-pattern: the ambiguous tick. A single indicator that renders “verified fine” and “could not check” identically. Every one of my four failures had one.
Pattern: make the healthy state loud. Emit a heartbeat when things are working and alarm on its absence. This is the dead-man’s switch, and it is the only construction that turns silence into information.
Anti-pattern: counting manual runs as the cadence working. Check the trigger type, not just the outcome. A human pressing the button is the thing you were trying to eliminate.
Pattern: never let “I cannot tell” exit zero. Unknown is not pass. If a check cannot reach its evidence, it must fail loudly and say which evidence it could not reach.
Anti-pattern: fixing accretion with a cleanup. A one-time trim of anything — prompt, config, dependency list, meeting invite — regrows, because the forces that grew it are untouched. Budget it instead, and make the budget fail the build.
Pattern: separate “could not look” from “it is gone.” My satellite checker short-circuits every other test when an upstream is unreachable, because a 403 otherwise looks exactly like zero stars, no commits and no activity — that is, like a repository that should be deleted. The most dangerous bug in an auditing tool is confident action on missing data.
The mechanism
Every one of these failures has the same shape. There is a channel that carries a signal — a badge, a dashboard, an exit code, a word like “merged” — and the channel has a default value it emits when nothing is driving it. That default is almost always the reassuring one: green, zero, empty, quiet. Systems are built to be quiet when idle, and idle-because-healthy is represented the same way as idle-because-dead.
So the mechanism of the bug is not neglect. It is encoding collision: two states of the world are being transmitted with one symbol, and the receiver has no way to decode which was sent. Being more careful cannot fix an encoding collision. Only adding a bit can.
The first principle
Any monitor that can fail into the same observation as success is not a monitor; make the healthy state emit a signal, so that absence becomes unambiguous.
What we do now, and what we do proactively
Retrospectives are cheap. Here is what actually changed, and what a reader can copy.
Now, shipped: a weekly fleet audit that scores every repository on six dimensions, where one of the dimensions is liveness of scheduled work — it reads each cron workflow’s run history and requires a run whose trigger was the schedule and whose conclusion was success. Manual runs explicitly do not count. A deployment endpoint that publishes the serving commit, and a checker that exits non-zero when it cannot verify. A static scan for swallowed errors that found 43 in one repository, of which the two I sampled were both real: a corrupted ledger silently reading as “no decisions”, and a permissions call whose failure would have left credentials in a readable directory. Size budgets on the prompt files. A satellite sync that proposes, and never performs, removals.
Proactively, the rules I now apply before shipping any automation:
1. Before adding a scheduled job, verify the ones you have. This is the highest
return-on-effort check in this entire article and it took me four minutes. List your cron workflows,
filter their run history to event == "schedule" and conclusion == "success",
and look at the most recent one. I predict you will find at least one that has never fired. Do this
before you add another, or you are building on a floor you have not tested.
2. Schedule off the hour. Cron at :00 is where every scheduler on
earth queues up and starts dropping work. It costs nothing to pick :20.
3. Route failure to a place a human already looks. A red square in a tab nobody opens is silence with extra steps. Ours opens and updates a single issue — one, updated in place, because a new issue every week trains you to ignore issues.
4. Make every gate refuse on ignorance. In our audit, a required dimension that is unmeasured fails exactly like one that is broken. Scalability, honestly, we cannot measure today — so it is marked unmeasurable and excluded from the score rather than given a fake proxy. A gate that passes because nobody looked is the fake green all of this exists to prevent.
5. Ratchet, do not trim. Whatever you clean up, pin the cleaned value as a budget in a test the same day. Otherwise you will be back in eleven days.
6. When your tool is wrong, write the wrongness down where the tool lives. Our playbook now carries a dogfooding log of the six things the new audit got wrong on its own first run — the secret scanner that flagged its own test fixtures, the independence check that flagged itself because its own regular expression contained the words it was searching for. A detector that fails its own test is a detector nobody trusts, and a false positive that survives is how a check gets switched off.
I will end on the honest edge. Everything above is now measured, and none of it is finished.
Update, 2026-08-04 — this article was wrong within a day
The paragraph that stood here said the new weekly workflow had not yet had a scheduled run and that its first opportunity was days away. It had already fired. The cron said Monday 16:20 UTC; GitHub ran it at 18:05, an hour and three quarters late, and I checked the wrong way and concluded it had not run at all. So the correction is: it did fire, and it failed.
It failed for two reasons, and both are this article's own thesis biting the article. First, the
baseline it ratchets against was captured on my laptop, keyed by local directory names, while the
job audits GitHub repository names — so AnyAgent and anyagent read as two
different projects and the flagship repo looked like a brand-new arrival failing two dimensions.
Two names for one thing. Second, and worse: the step that reports findings to a human passed a
--label that does not exist, and I had written that call to ignore its own exit code.
So the audit ran, found ten regressions, and told nobody. The job built to detect
silent failure failed silently, at the exact step whose job was not to.
Both are fixed: repository keys now compare case-insensitively, the baseline is regenerated from the CI run rather than from my laptop, the reporting step drops the label and raises on a non-zero exit, and a following step asserts the issue actually exists before the run may pass. The seventy-six unpinned satellites are now pinned — seventy-four pushed, two committed locally only because that repository has no remote. The skill file is still a monolith in the places I have not split. And this update is the point: I published a claim about silence and got it wrong by not checking, which is precisely the failure mode the piece is about.
I am publishing the number rather than the intention, because the whole lesson of the week is that intentions and silence look the same from outside.
References
- Ewaschuk, R. (2016). “Monitoring Distributed Systems.” In B. Beyer, C. Jones, J. Petoff & N. R. Murphy (Eds.), Site Reliability Engineering: How Google Runs Production Systems. O’Reilly Media. sre.google/sre-book/monitoring-distributed-systems (accessed 4 Aug 2026).
- PromLabs. (n.d.). “End-to-End Watchdog Alerts.” Monitoring and Debugging Prometheus. training.promlabs.com (accessed 4 Aug 2026).
- Vercel. (n.d.). “Limits — Deployments.” Vercel Documentation. vercel.com/docs/limits (accessed 5 Aug 2026).
- Griciūnas, A. (2026, March 11). “Agent Skills: Progressive Disclosure as a System Design Pattern.” SwirlAI Newsletter. newsletter.swirlai.com (accessed 4 Aug 2026).
Written by Paul Jialiang Wu. The measurements are from my own repositories, taken 2026-08-02 to 2026-08-04. Every quotation above was verified verbatim against its source.