AI-NATIVE SERIES · Evaluation Engineering
Confidence Calibration: the Agent Was Most Wrong Exactly Where It Was Most Sure
1-minute takeaway — what you'll walk away with
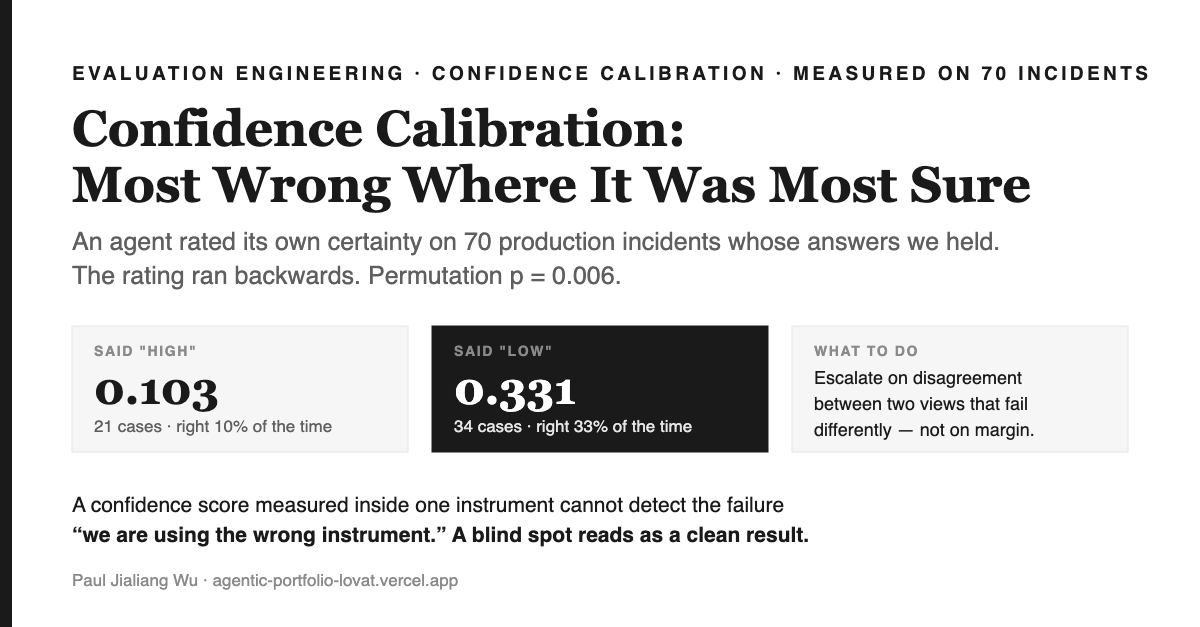
What this is. A measurement. A root-cause agent was asked to rate its own certainty — High, Medium or Low — on 70 production incidents whose true answers we held. The rating ran backwards: the cases it called High it got right 10% of the time; the cases it called Low, 33%. Permutation test, p = 0.006.
Why it matters. The standard human-in-the-loop design escalates low-confidence cases to a person. On this agent that design would have routed humans to the work already done correctly, and auto-approved the errors. Any system that rates its own certainty inside a single source of evidence has this failure available to it, and the failure is silent.
What you can do. Stop thresholding on self-reported confidence. Build a second view that fails differently and escalate on disagreement between the two. The article gives the mechanism, the arithmetic, and the one-page test to run on your own system this week.
What confidence calibration is, and who this is for
Confidence calibration is whether a system's stated certainty predicts its accuracy. It is written for anyone shipping a model that gates work — an agent that triages, a classifier that routes, a scoring function that decides what a human sees. You do not need the incident-response domain to use it.
The evidence comes from one afternoon of measurement on a public benchmark, so every number here is small and every number here is real. One analogy carries the whole piece, and it is worth introducing on purpose rather than sliding into it.
The kitchen, and the three questions
A restaurant is failing. Orders are twenty minutes late and the manager hands you a box: every thermometer reading from every stove, every line cook's notebook, every order ticket stamped at each station. Thirty minutes of one bad evening, several gigabytes of it. Three questions: when did it start, which station caused it, and why.
Swap the restaurant for a microservice system and you have OpenRCA, an ICLR 2025 benchmark of real production telemetry with injected, labelled faults. The mapping is one-to-one and it holds for the rest of the article:
| Kitchen | System |
|---|---|
| A station (one stove) | A container — one replica of one service |
| The building's gas main | A node — the host several containers share |
| Thermometer readings, sampled | Metrics — CPU, memory, I/O, per series, per minute |
| An order ticket, stamped at each station | A trace — parent and child spans with durations |
| “Which station jammed, when, and why” | Root cause: component, timestamp, failure reason |
The hard part is not spotting trouble. When one station jams, every station downstream backs up, and the ones nearest the customer complain loudest. Twelve stations are screaming. The loudest complaint is usually a victim, not the culprit. Published state of the art on this benchmark solves about one case in nine.
The measurement
Our agent ranks candidate components by how far each deviated from its own day-long baseline — a robust z-score using median and MAD, so one spike cannot set the scale — and dates the fault at the first sample to leave the band. It scores 0.199 against the provided baseline's 0.073 on all 70 dev cases.
It also writes a confidence word into every case file, computed rather than asserted: High when one component dominates on magnitude and nothing anomalous started before it, Low when a rival moved earlier or the margin is thin. Because we held the answers for all 70, we could ask whether that word means anything.
| Stated confidence | Cases | Mean score |
|---|---|---|
| High | 21 | 0.103 |
| Medium | 15 | 0.033 |
| Low | 34 | 0.331 |
Low minus High is +0.228, bootstrap 95% CI [+0.064, +0.385], permutation p = 0.006. It is not task-type confounding: the inversion holds inside individual task types — on the time-only task, High scores 0.000 against Low's 0.500.
Two disclosures, because a number without its limits is marketing. This is 70 cases, and per-case scores have a standard deviation near 0.3 — which is exactly why two other findings from the same afternoon did not survive the same test, and were struck from our report. The inversion survived it. And the confidence rule is ours; a different rule would invert differently or not at all. What generalises is the mechanism, not the coefficient.
Why it runs backwards
Here is the part worth carrying out of the kitchen.
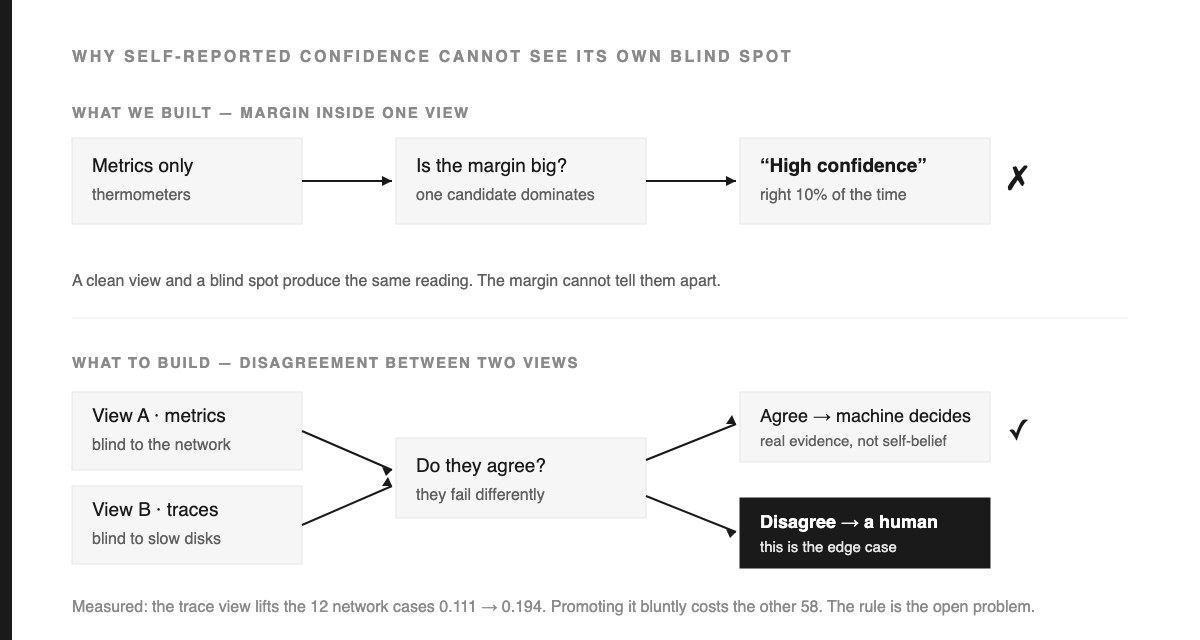
High is awarded for a clean picture: one component clearly worst, nothing moving before it. But a clean picture is also precisely what you see when the fault is invisible to the instrument you are holding.
About a quarter of the true causes in this data are network faults — latency, packet loss, retransmission, corruption. They barely register in metrics at all; they live in the gap between a parent span and its child, the time on the wire that nobody's CPU spent. Our metrics-only agent scores 0.111 on those cases against 0.217 on everything else.
So when the thermometers look tidy, sometimes nothing is wrong with the stoves — and sometimes the fire is somewhere a thermometer cannot see. From inside the thermometer, those two look identical. The agent's certainty is not a claim about the world; it is a claim about the tidiness of one view, and a blind spot is maximally tidy.
The principle, and it is not about incidents
A confidence score measured inside one instrument cannot detect the failure “we are using the wrong instrument.” A blind spot and a clean result are the same reading.
A physician reading only bloodwork can be certain and wrong, and the bloodwork will not warn them — only an X-ray will. A survey with a tight margin of error is still wrong if it sampled the wrong frame, and nothing inside the survey reveals it. Precision is not accuracy, and a system measuring its own precision will mistake one for the other every time.
This has a name in the literature. A model can be sharp — confident, decisive — and badly calibrated; sharpness subject to calibration is the standard framing, and modern networks are known to grow more confident and less calibrated as they get larger (Guo et al., 2017). What the incident above adds is narrower and more actionable: even a well-calibrated score cannot represent evidence its own channel never received.
What to build instead
Replace “how sure is the model?” with “do two views that fail differently agree?”
view_a = rank_from_metrics(window)      # thermometers
view_b = rank_from_traces(window)       # order tickets
if view_a.top == view_b.top:            # agreement across failure modes
    decide()
else:
    escalate(view_a, view_b)            # this is the edge case
Agreement between instruments that fail in different ways is evidence. A single instrument's self-assurance is a restatement of what that instrument can see.
We built the second view — the 95th percentile of each caller's parent-to-child span gap — and the honest result is mixed, so here it is in full:
| Configuration | All 70 | The 12 network cases | Other 58 |
|---|---|---|---|
| Traces off (shipped) | 0.199 | 0.111 | 0.217 |
| Always prefer the trace view | 0.163 | 0.194 | 0.157 |
| Prefer it above a magnitude gate | 0.194 | 0.111 | 0.211 |
The second view works — it lifts the network cases 75%, from 0.111 to 0.194, the largest single gain we found. And our rule for using it is too blunt to collect the gain, because it also fires on the 58 cases the metrics already had right. So we shipped with it off.
Which is the finding, not a failure: we located the signal and do not yet know how to promote it without collateral damage. The next move is a rule that asks which view should decide this case rather than one that lets the loud view win — and that rule is the same object as the escalation trigger. Disagreement routes to a human; agreement routes to a decision.
Where the humans go
The useful split is not “hard work to the machine.” It is whether being wrong is detectable.
| Work | Who leads | Why |
|---|---|---|
| Parsing, arithmetic, output format | Machine alone | A wrong answer is caught by a test in one second. |
| Picking the culprit from evidence | Machine leads, human audits | It writes down every number it used, so a human checks the work without redoing it. |
| Cases where the two views disagree | Human leads, machine assists | The only honest signal that this case is unusual. The machine lays out both readings; it does not break the tie. |
| Defining the right answer for a novel failure class | Human alone | No ground truth to check against. This sets the standard the machine is later scored on. |
And one rule we would put on the wall: never escalate on the model's self-assessment alone. We have a measured case where that is worse than random.
Run this on your own system this week
- Find 50–100 cases where you know the answer. Resolved tickets, labelled reviews, anything with a verdict.
- Bucket by what your system said about itself — the confidence score, the priority, the risk tier.
- Compute accuracy per bucket and run a permutation test. Flat is common. Inverted is the one that costs you.
- If it is flat or inverted, do not tune the threshold. Add a second view that fails differently and measure agreement instead.
The whole measurement above is about forty lines of Python. The expensive part was being willing to point it at our own output.
What we are not claiming
We did not beat the AI; we beat one way of using it. The shipped agent calls no language model. We tested one — the strongest in its family, reasoning enabled, handed the ranked candidate table — and it changed zero of twenty answers, agreeing with the calculation every time while spending eight minutes of a twenty-minute budget. But we gave it a finished summary and asked it to choose. We never gave it tools to query the telemetry itself — narrow the window, pull another series, walk a trace. That is a different system and this result says nothing about it. It is the first thing we would build next.
Our held-out score will be lower. The constants were chosen while looking at all 70 cases. That is leakage, named rather than hidden.
Three of our four findings that day were negative, and one of them was a retraction of our own earlier claim. Those are the ones we would want in the room at 3am when something is actually broken.
Update, same day: we ran the same decomposition on ourselves
After publishing the above we turned the method on our own accuracy, and it found something larger than the calibration result.
The benchmark scores three elements separately — when, which component, why — and nobody had looked at them separately. Doing so took one query:
| Element | Accuracy |
|---|---|
| Occurrence time | 27.3% |
| Root cause component | 14.8% |
| Failure reason | 23.6% |
Component was weakest, which raises the only question worth asking next: is the right answer even on our list? It was there 53.7% of the time. And recall@1 was 14.8% — identical to our component accuracy, confirming we emit rank one and nothing else. So 46% of the time, no amount of better ranking could have helped us.
The missing names told us why instantly: recommendationservice, paymentservice, emailservice. Service-level names, with no pod suffix.
The ground truth names components at three levels — service 44%, node 37%, pod 19% — and we produced two of them. Our code turned node-5.adservice-2 into the pod, so a bare service name was unreachable by construction. Before a single line of ranking logic ran, our ceiling on component accuracy was 56%.
And the sensor was sitting in the bundle untouched: metric_service.csv, 1 MB a day against the container file's 265 MB — the cheapest file there — whose service column is <name>-<protocol>. Stripping the protocol recovers all nine ground-truth service names exactly.
Reading it took reachability from 53.7% to 96.3%. And the score fell, 0.199 to 0.151.
Because a z-score from request-rate and one from CPU-seconds are not the same quantity. Ranked against each other, services took 68% of the rank-one slots while being 44% of the answers — they shouted louder, so they won, displacing correct node and pod answers. The identical mistake we had made with the trace view four hours earlier. A new view is only as good as the rule deciding when it wins.
Scoring each series against its own source's distribution recovers most of it (0.169), and made the component-only task score above zero for the first time in six configurations. Still below the shipped version on all 70 cases, so the shipped version stays — we do not ship a regression to make a story neater.
What this does to the headline above
We reported that the strongest model in its family, reasoning enabled, changed zero of twenty answers when asked to pick from our ranked table, and concluded the model added nothing.
That was measured on a table that did not contain the answer 46% of the time. A model cannot choose a name it was never shown. The measurement was correct; the interpretation was too broad, and we would have shipped it that way had we not decomposed the accuracy.
With the fixed table the shape is different in exactly the way that matters: recall@1 is 16.7% while recall@3 is 38.9%. The answer is usually in the top three and we pick the wrong one of the three — a judgement problem on a short list, not retrieval. So we predicted the model would finally earn its place, and re-ran it on the fixed table.
It changed zero of twenty answers again. Same as before, on a table that now contains the answer 96% of the time.
| On the same 20 cases | Score | Answers changed |
|---|---|---|
| v1, shipped | 0.225 | — |
| v2.1, no model | 0.250 | — |
| v2.1 + GLM-5.2, reasoning on | 0.250 | 0 / 20 |
So our hypothesis was wrong, and being wrong is the useful part. The model was never information-starved. Handed a list that is already sorted, it takes row one and writes a justification — it anchors on our ordering and rubber-stamps it. Give it better rows and it rubber-stamps those instead.
Which relocates the problem again. It is not the data we showed the model, it is the shape we showed it in: a ranked list carries our answer inside its order, and the model reads that as the answer. Getting independent judgement would mean taking the ordering away — shuffling the candidates, or scoring each one alone without its neighbours. We have not tested that, and we are not going to claim it works.
Decompose before you optimise. We spent a day improving a ranking whose answer was absent from the list half the time. One query — accuracy split by the thing being scored — would have found it in the first hour.
References
- OpenRCA: Can Large Language Models Locate the Root Cause of Software Failures? — ICLR 2025. The benchmark, its 335 cases and the published baselines.
- On Calibration of Modern Neural Networks — Guo, Pleiss, Sun, Weinberger, ICML 2017. Larger networks grow more confident and less calibrated.
- Probabilistic forecasts, calibration and sharpness — Gneiting, Balabdaoui, Raftery, JRSS-B 2007. Sharpness subject to calibration.
- microsoft/OpenRCA — the dataset and reference agent (MIT).
Measured 17 September 2026 on the Market/cloudbed-1 deployment of OpenRCA, 70 labelled cases. Bootstrap and permutation tests at 10,000 resamples, seed 0. Every table here reproduces from the project's own make targets.